Would you rather live an extra 25 years or get 1 billion dollars? [#20]
How can you maximize your own total life happiness?
![Would you rather live an extra 25 years or get 1 billion dollars? [#20]](/content/images/size/w1200/2023/06/100dollarbills.jpeg)
Imagine that you're now 40 years old.
If you live in the US, you can expect to live for another 35-ish years – longer if you're a woman, and shorter if you're a man. You have two options:
Option A: You get to live for an additional 25 years past your original date of death (so you'd live to be ~100 years old). This doesn't mean that you're invincible or immortal, though.
Option B: You receive 1 billion dollars (USD) instantly. You can use the money however you'd like.
Which option would you choose? Is one more beneficial to your overall life happiness? Is one objectively better? I'll explore these questions (and more) in this article. But first, make sure you choose either Option A or Option B. At the end of the article, I'll see if I've changed your decision.
1. The Equation for Total Life Happiness
Let's start with a simple equation¹:
Total Life Happiness (TLH) = Total Lifetime (TL) x Average Life Happiness (ALH)
This makes intuitive sense:
- If Charlie had a super awesome childhood where their family was super rich but he died at 20, his ALH would be high, but his TL would be low.
- If Dana lived to be 100, but she lived in poverty for 75 of those years, her TL would be high, but her ALH would be low (since poverty sucks).
Both Charlie and Dana would have relatively low TLH. But our equation might need a bit of a remodel – since basically no one maintains the same level of happiness throughout their entire life. So here's a revised equation:
Total Life Happiness (TLH) = the area under the line of a happiness vs. time graph
2. How to Calculate Total Life Happiness
Okay, but how exactly do you calculate TLH? What does a graph of happiness vs. time even look like? Let's look at a graph of Ernest's life to clear everything up:
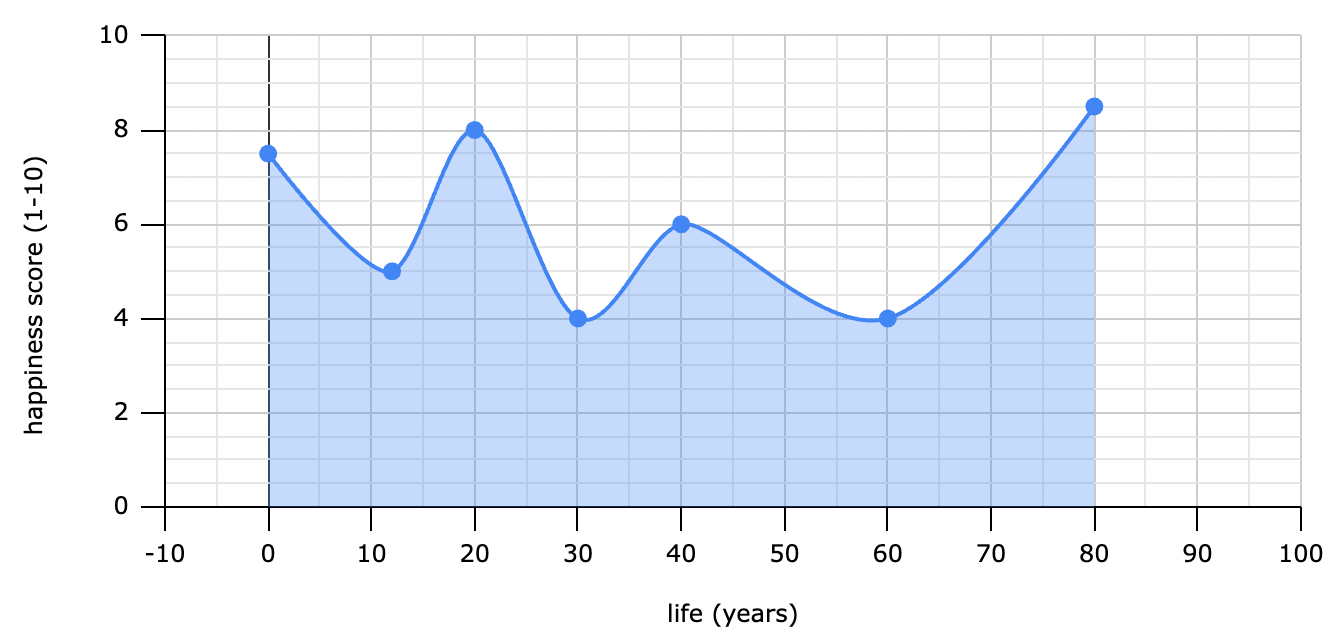
The most important thing you need to know:
Total Life Happiness (TLH) = the total blue area
A few extra notes to help clear things up if you're confused²:
- The x-axis has units of years, and the y-axis has units of "happiness score".
- At any point when someone is alive, they have a certain happiness score from 1-10. As a reference: 1 = life is completely terrible; 3 = life is pretty bad; 5 = life is okay; 8 = life is pretty great; 10 = life is completely awesome.
- You can't obtain meaningful measurements about a person's happiness when they are dead. So the graph cuts off at x = age of death (here, the graph cuts off at x = 80, since Ernest died at 80).
Let's also take a look at the events of Ernest's life:
- Ernest was born in a small town in Minnesota. It's pretty hard to be pessimistic about life when you're a baby, and since Ernest's parents raised him well, he had a happiness score above 6 for the first ~6 years of his life.
- Most preteens (and teenagers) are typically moody and rebellious – and Ernest was no exception. That's why his happiness score descended to a relative low of 5 when he was 12 or 13.
- When Ernest turned 19, he got an amazing job at Wall Street and got a really hot new girlfriend. So Ernest was super happy & satisfied, and reached a relative peak happiness score of 8 at around when he was 20.
And so on.
Ernest's Life Happiness graph represents our lives pretty well. You may not have the same ups and downs as Ernest, but really, all of us have ups and downs.
"Life is like topography, Hobbes. There are summits of happiness and success, flat stretches of boring routine, and valleys of frustration and failure." – Bill Watterson, Calvin and Hobbes
3. Live an Extra 25 Years or Receive $1B?
So let's return to the original question: assuming you are now 45 years old, would you rather have 25 additional years of life or 1 billion dollars? Well, let's look at the graphs of our next two subjects: Fred and Greta.
Three things to keep in mind:
- Fred chose Option A (25 extra years of life).
- Greta chose Option B (1 billion dollars).
- For the sake of simplicity, Fred and Greta have exactly identical life happiness graphs until the age of 40.
Let's look at the lives of Fred and Greta.
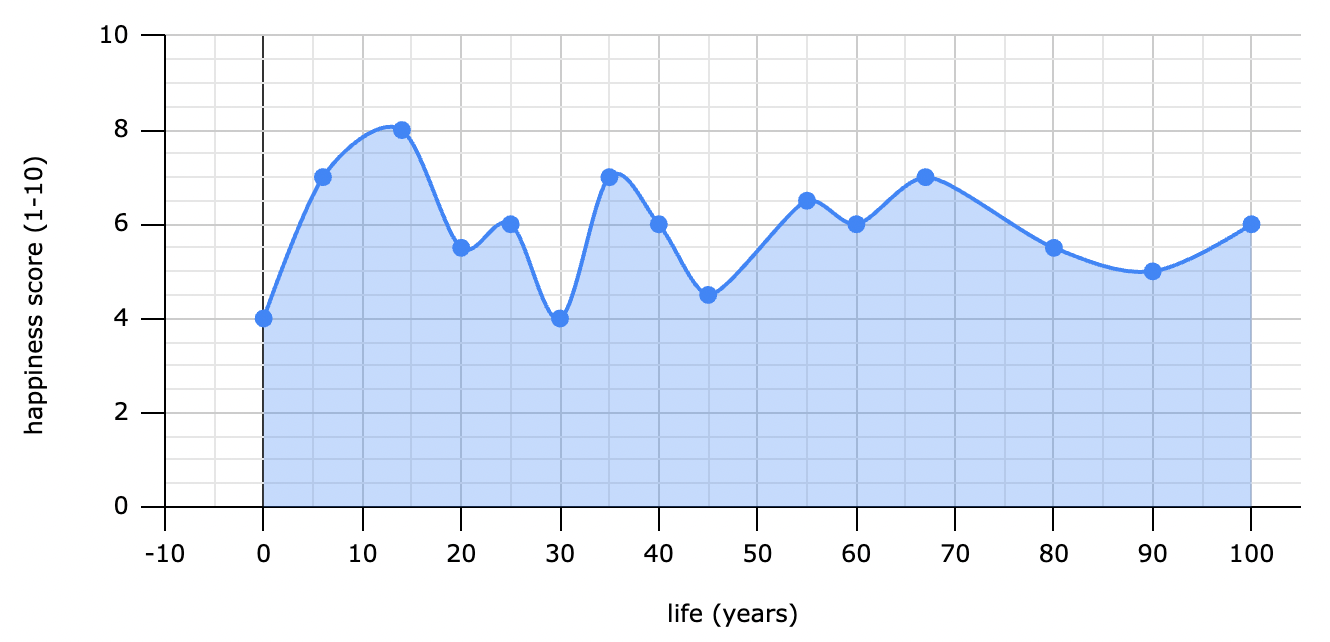
Fred
So after choosing Option A, Fred's overall happiness levels initially drop because of his wife's sudden, tragic death. But by the age of 55, he's back at a respectable happiness score of 6.5, and his happiness score stays relatively level until he dies at 100.
How is Fred able to rebound from his wife's death so quickly? It's due to the hedonic treadmill, which you'll read about shortly.
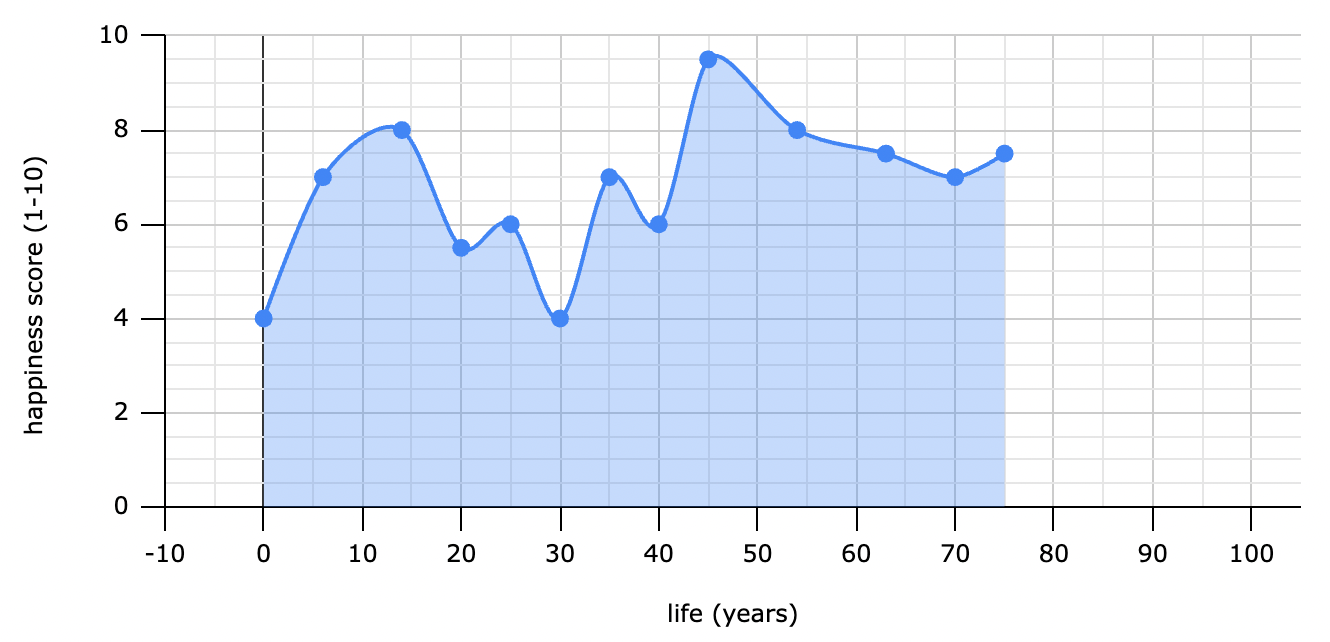
Greta
After receiving 1 billion dollars at 40, Greta becomes very happy. She now has her own private jet, seven beach houses, and doesn't have to work another day in her life. Because of this, Greta's happiness score peaks at 9.5 when she's 45.
But something intriguing happens when Greta grows older. Her average happiness score slowly begins to decline until it reaches 7 – which isn't that far above her original baseline happiness level of about 6. This is consistent with something called the hedonic treadmill:
"The hedonic treadmill, also known as hedonic adaptation, is the observed tendency of humans to quickly return to a relatively stable level of happiness despite major positive or negative events or life changes." – Wikipedia
Remember, Greta dies at 75. So while she reaps the benefits of having an increased average happiness score than Fred, she also dies earlier than Fred.
Take another look at the graphs of Fred and Greta:
Who do you think has the higher TLH?
And if your goal in life is to maximize your TLH, you may be torn between the paths of Fred and Greta. Is it better to live longer and to be less happy, or vice versa?
4. How to Maximize Your Own Total Life Happiness
Let's say your sole goal in life is to maximize your own total life happiness. There are two main ways to do that:
- Increase your total lifetime (TL)
- Increase your average life happiness (ALH)
To increase your TL, you should:
- Eat a healthy diet
- Get some exercise
- Stay socially connected
And generally do things that are, well, good for you.
But what about increasing your ALH? (Remember that ALH is a combination of both short-run happiness and long-run happiness.) Take a look at this image, which I call the Happiness Matrix:
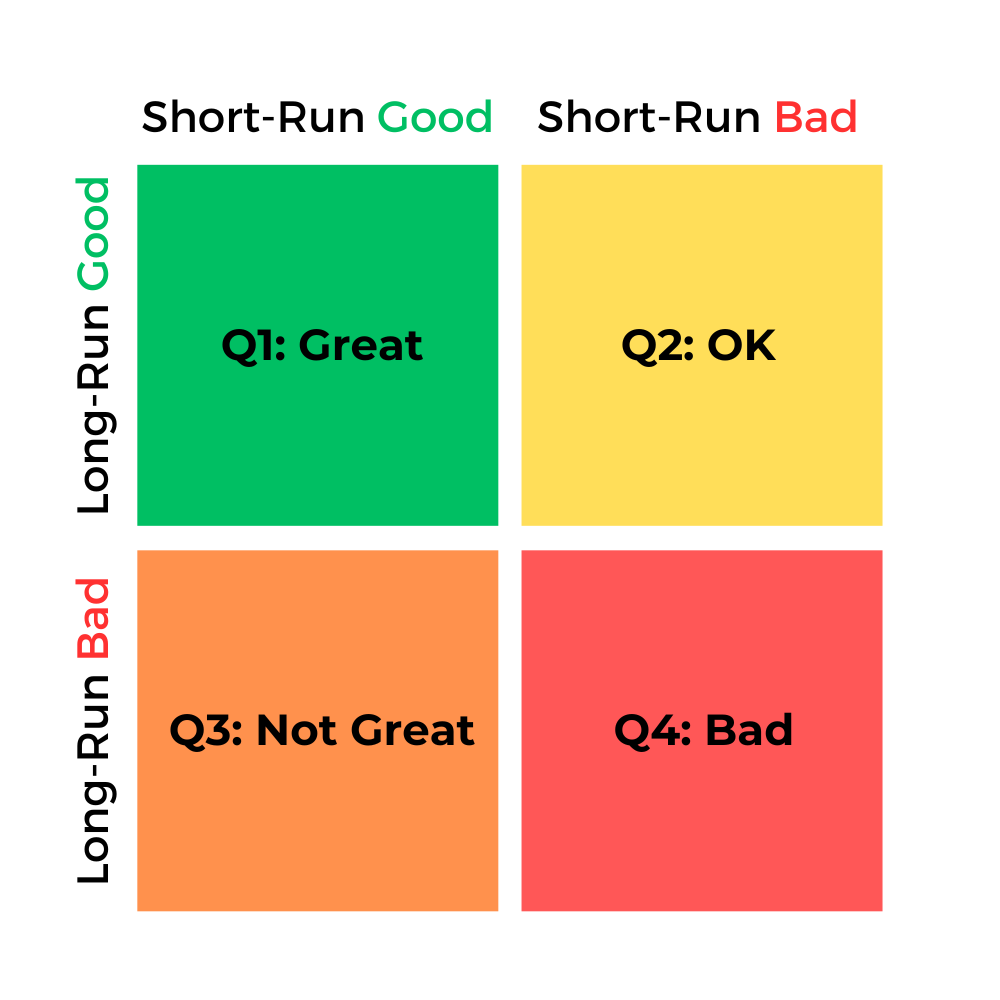
I'm going to use another abbreviation here: "for your happiness" = FYH. Let's look at each of these quadrants in turn:
- Q1: Things that fall in Q1 are both long-run good FYH and short-run good FYH. You should always do activities that fall into Q1. Examples include: eating delicious and nutritious food, working out (since endorphins), and spending time with loved ones.
- Q2: Things that fall in Q2 are long-run good FYH but short-run bad FYH. You should generally do activities that fall into Q2. Examples include: saving money (if you love buying new things), learning a new skill, and studying for difficult but important exams (if you're a student).
- Q3: Things that fall in Q3 are short-run good FYH but long-run bad FYH. You should generally avoid activities that fall into Q3. Examples include: smoking, gambling, and overeating.
- Q4: Things that fall in Q4 are both short-run bad FYH and long-run bad FYH. You should always avoid activities that fall into Q4. Examples include: social isolation, scrolling through TikTok, and missing sleep.
If you didn't read any of the above, remember this:
When you choose to do an activity, consider the quadrant that the activity falls into. If it falls into Q1 or Q2, great! You should do the activity. But if it falls into Q3 or Q4, ask yourself: "Is this decrease in long-term happiness really worth it?"
5. How Does All Of This Apply To Me?
So we've covered life happiness graphs and the happiness matrix. But you've scrolled through the entire article, and you can't be bothered to remember all of the important stuff. So here's a nicely formatted TLDR for you:
1. Total Life Happiness (TLH) = the (blue) area under the line of a happiness vs. time graph.
2. If you want to maximize your TLH, you should aim to increase either your Total Lifetime (TL) or Average Life Happiness (ALH). To increase your TL, do things that seem healthy or listen to your doctor.
3. If you want to increase your ALH, do activities that fall in Q1 and Q2 of the Happiness Matrix. Avoid activities that fall in Q3 and Q4.
Thank you so much for reading this article! Please subscribe to support my writing.
Footnotes
¹ To say this equation is oversimplified would be a massive understatement – for the simple reason that you can't compress human life and happiness down into any equation, no matter how complex that equation is. But we use models all the time for analyzing the world, even if they don't encapsulate the full picture.
² For those who have taken calculus, TLH = the integral!
![I never want to write another proof again [#68]](/content/images/size/w960/2025/02/hayley-maxwell-bdvycycdu-M-unsplash-2.jpg)
![A midnight business proposal worth $100,000+ takes an unexpected turn [#31]](/content/images/size/w960/2023/07/dmitry-demidko-eBWzFKahEaU-unsplash.jpg)
![Why you should consider Santa's Sleigh™ Deliveries for your next package [#29]](/content/images/size/w960/2023/07/29-clean.webp)
![How to choose an incredible Christmas gift [#7]](/content/images/size/w960/2023/06/kieran-white-SBdmQcW8qag-unsplash.jpg)